Steps to insert and configure a new Gantt chart
Prerequisite: Metadata facet with date fields
First, we need to decide what we want to display in the Gantt chart. For this guide, we assume we want to place Milestones and Activities into a Gantt. A milestone only has an end date, an activity has a start and end date. We need to set up metadata for this, please refer to Manage structured metadata for more information on this general topic.
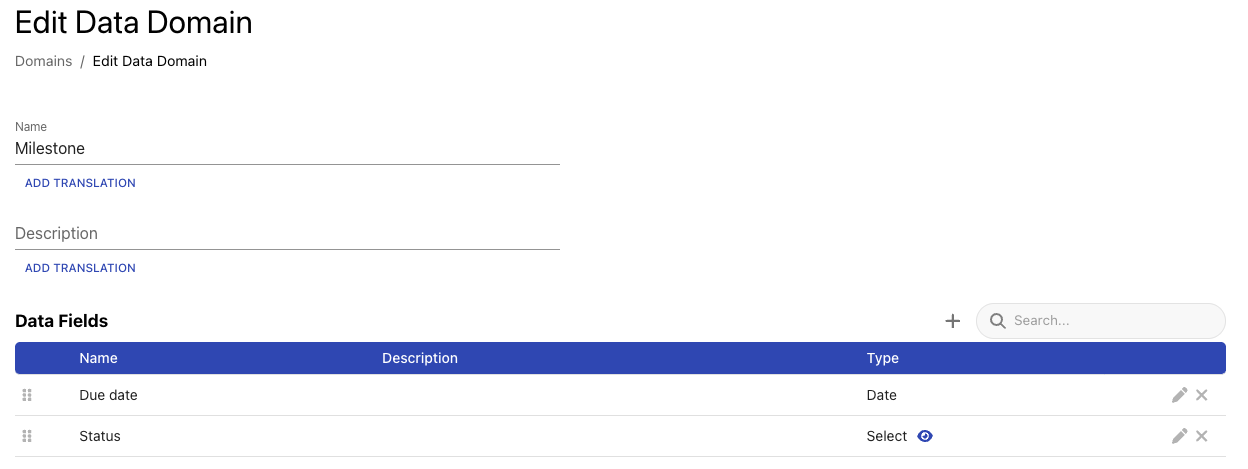
Configure Milestone
We could configure the milestone like this:
Configure Activity
Add facets to your topic
Activate the two new data domains as a facet in your topic.
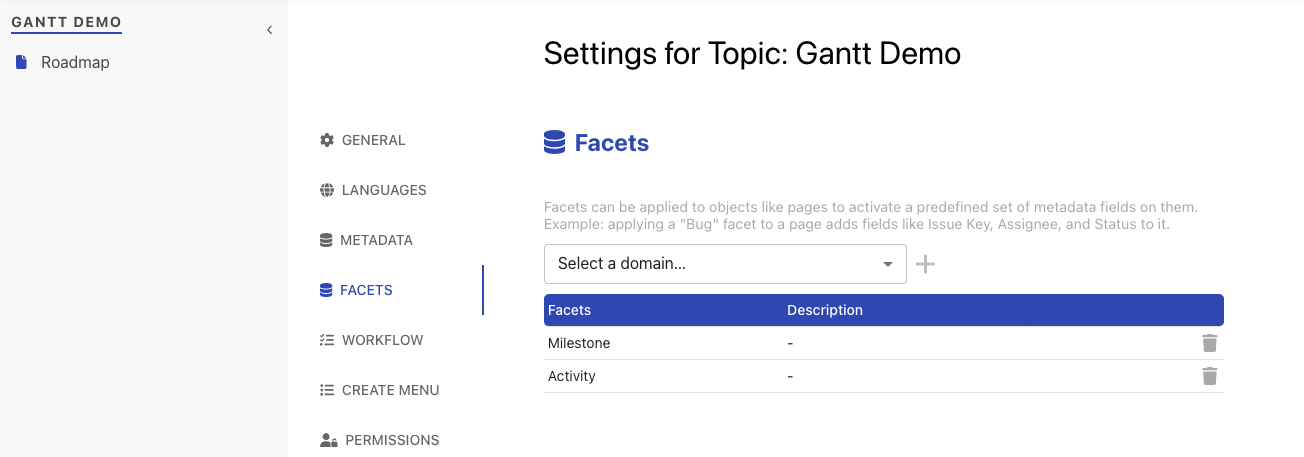
Now, any object in your topic can potentially carry the metadata for milestones or activities. Of course, you could now refine your templates for these types of pages, but as the minimal requirement is already fulfilled, we don’t go into details on this in this feature.
Insert Gantt chart
Insert the Gantt widget into any page using the +-Menu or typing /gantt:
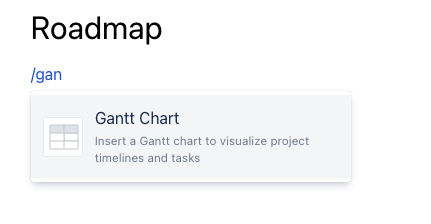
After this, we have an empty Gantt box and we need to add a data source from where we select objects to display.
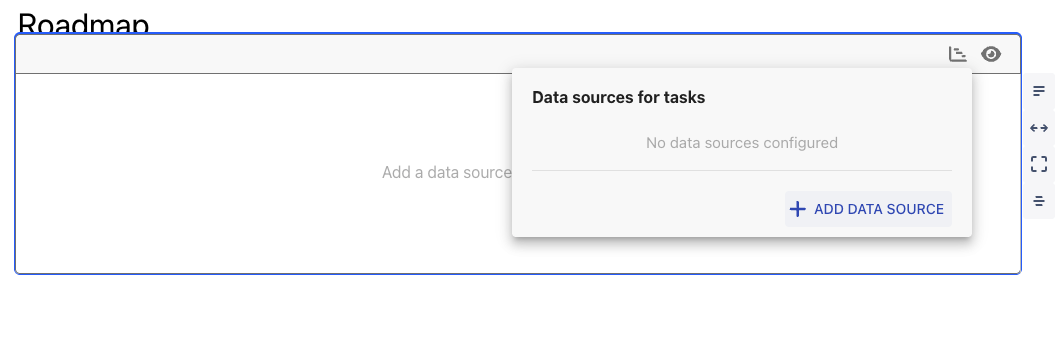
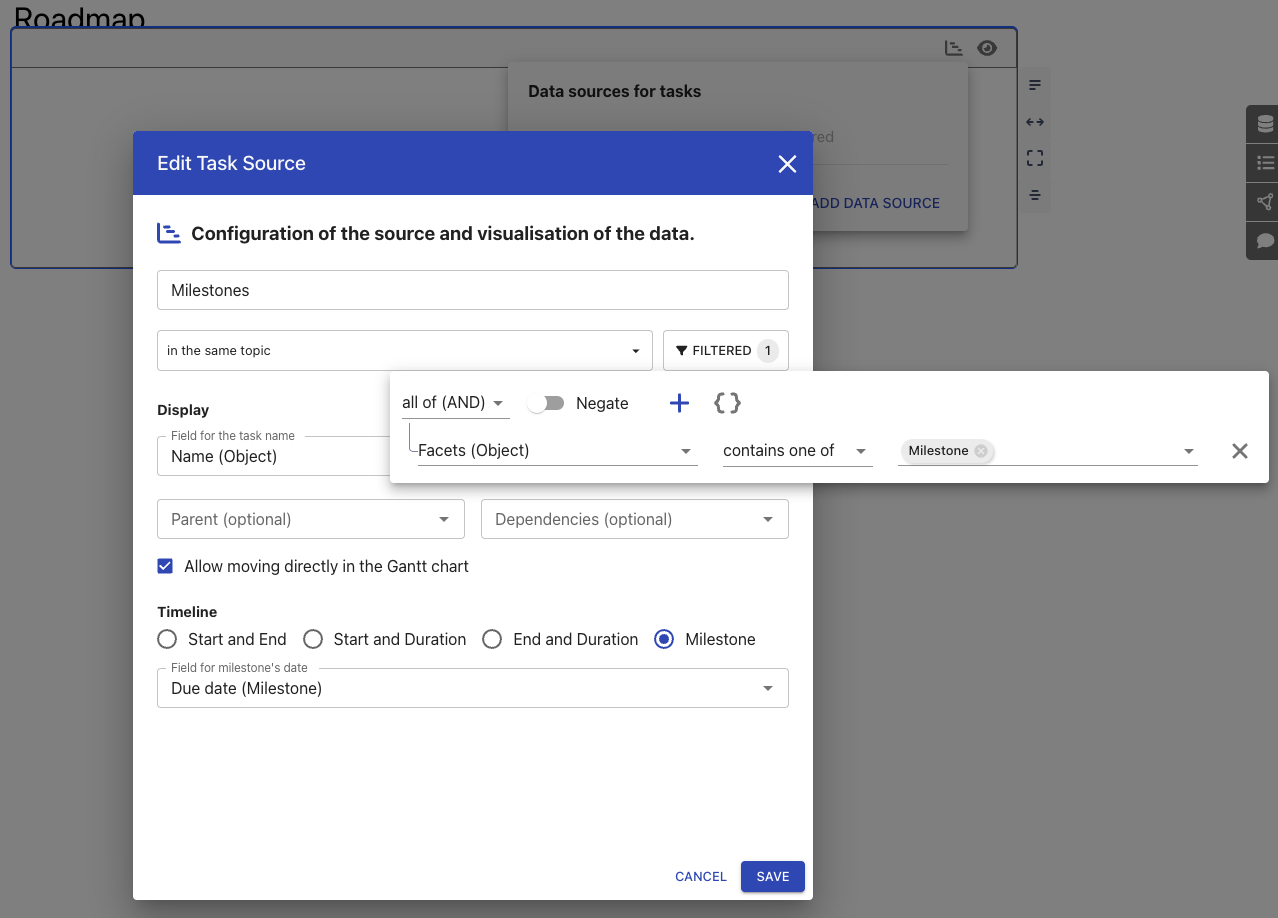
Let’s configure a milestone data source.
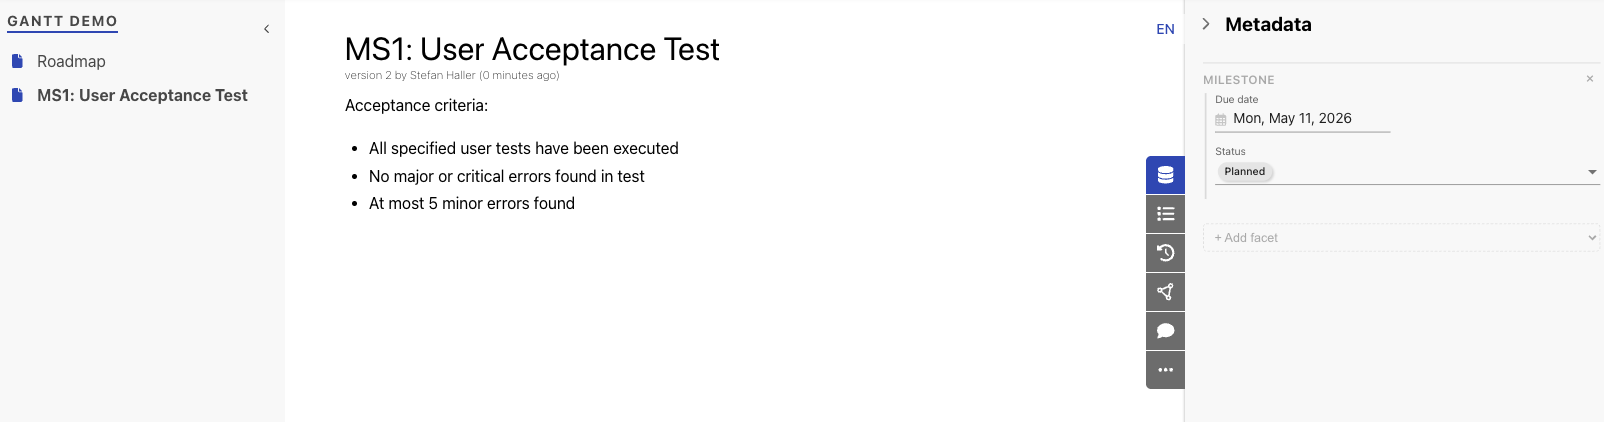
Now, let’s create a milestone object. For this example, we create a simple milestone page with acceptance criteria and add the milestone facet.
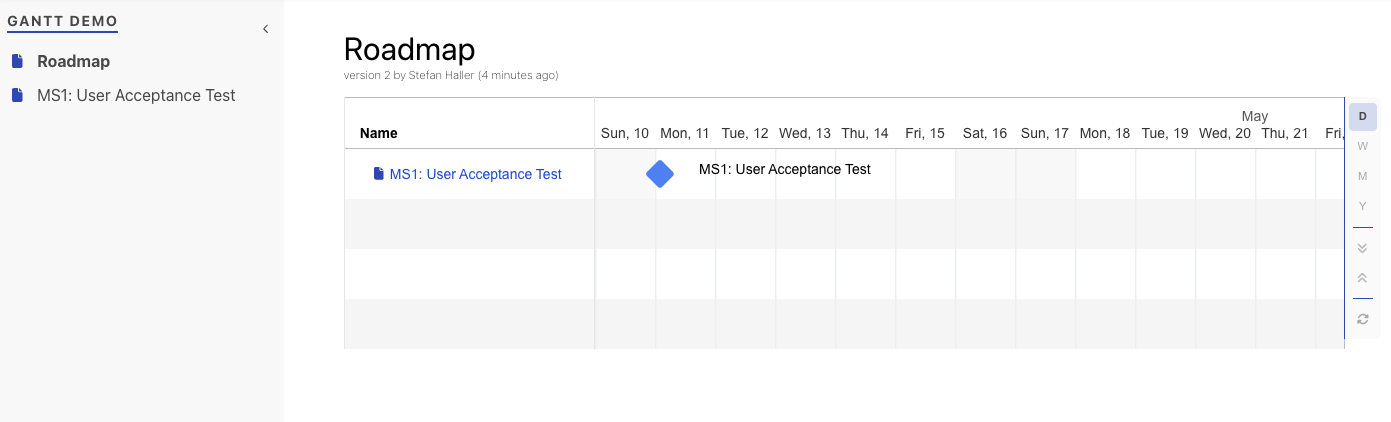
When we now display the Roadmap page with the gantt chart again, we can see our milestone.
Now, we can repeat this by adding a data source for activities.
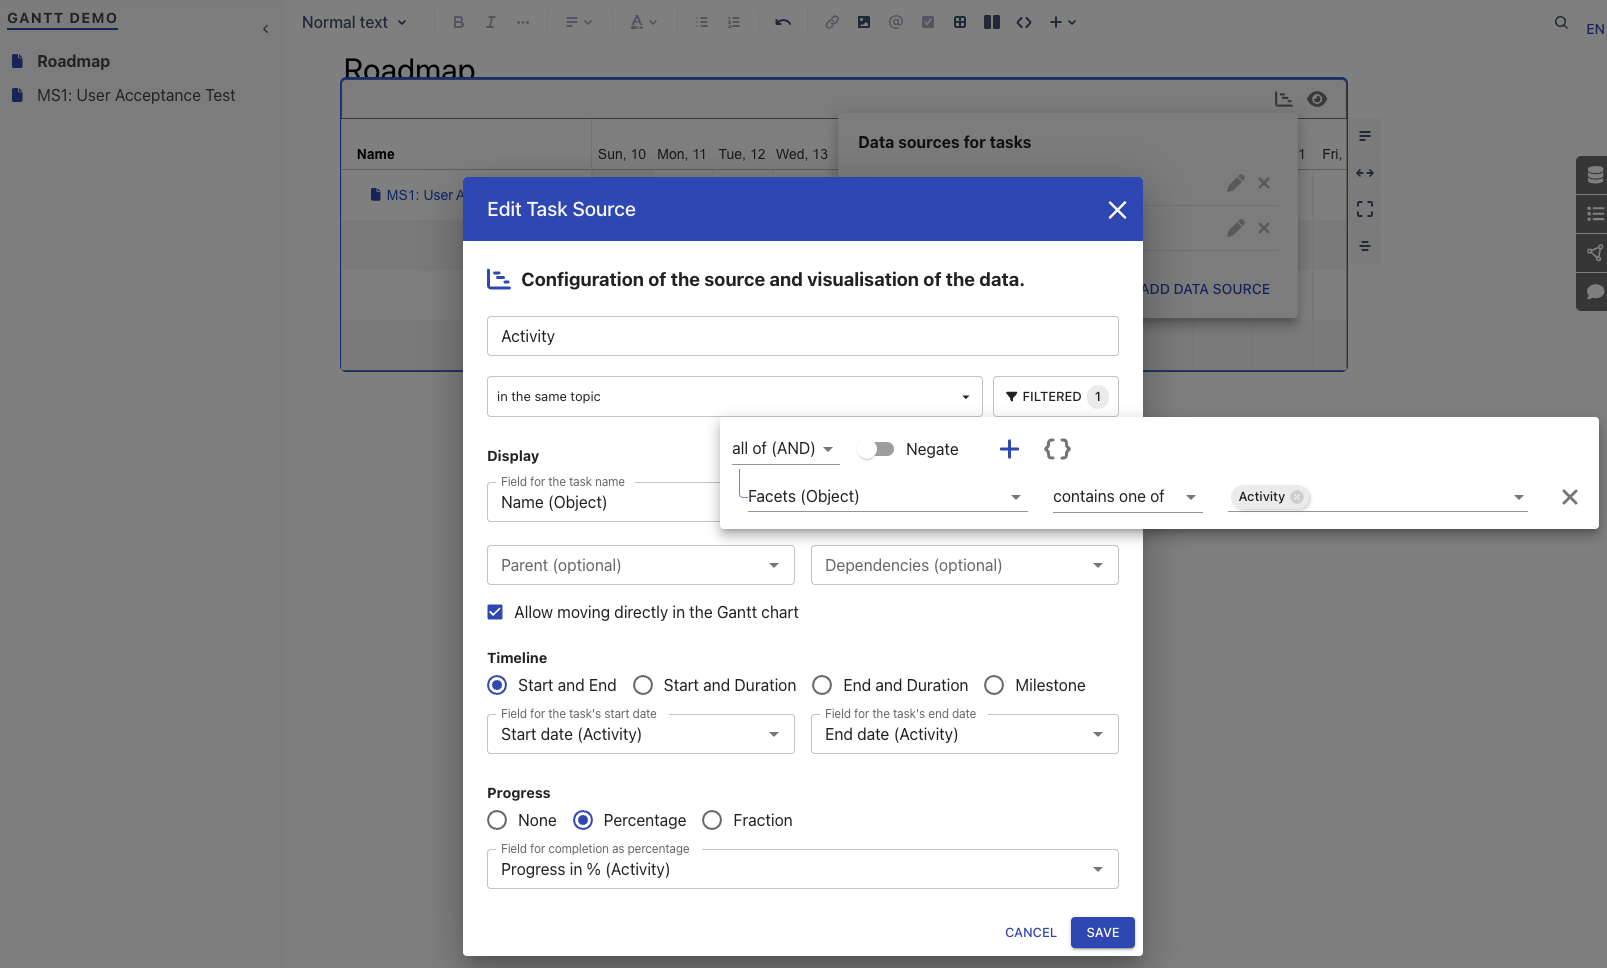
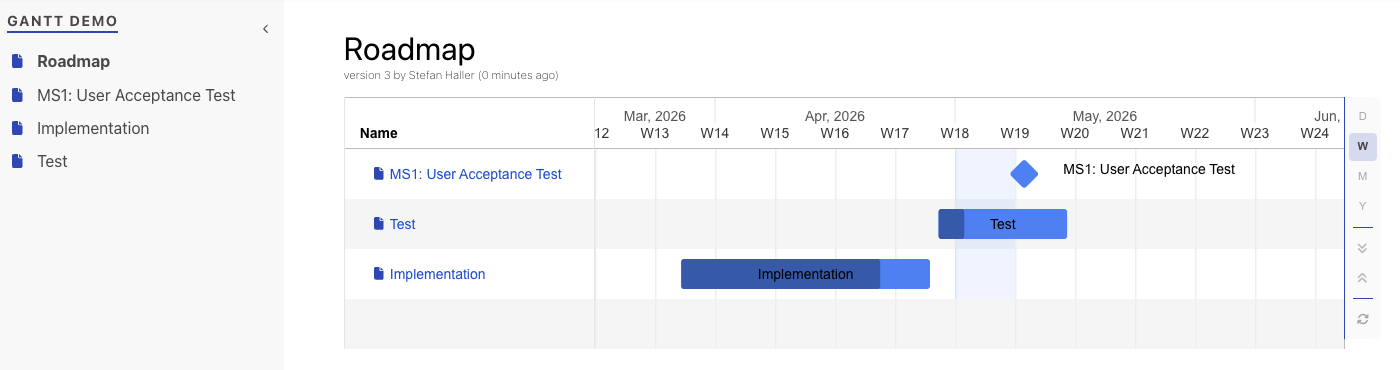
After we add some activity objects and refresh the gantt, we have a first simple Gantt with both milestones and activities.

These are the basics to configure a Gantt. This can now of course be refined through the many options we have like dependencies and so on.